Ice caps and glaciers in Iceland
About 75% of all freshwater on our planet (including groundwater) is presently locked up in Earth´s two large ice sheets (in Antarctica and Greenland) and in smaller ice caps and glaciers around the world. Mass loss by melting and calving is now occurring in nearly all glaciated regions of the Earth, leading to an annual rise in sea level by 3 mm, on average. Recent data indicate that the smaller glaciers and ice caps now contribute approximately one-third of the meltwater leading to rising sea level, the rest coming from the large ice sheets
Iceland´s location in a region of maritime climate in the North Atlantic ensures mild temperatures, high levels of snowfall during winter and extensive melting during summer. At present, ice caps and glaciers cover 10% of the country´s total area of 103.000 km2. The largest ice cap is Vatnajökull (8000 km2) and the total volume of glacier ice in Iceland is approximately 3600 km3. If all this ice were melted and spread uniformly over the country, it would form a 32 m thick water layer. The age of the oldest ice found in the glaciers is probably around 1000 years.
The positions of glacier and ice cap margins in Iceland have been monitored by scientists and volunteers over the past 80 years, and written sources yield information on glacier changes many centuries back in time. During historical time (i.e. since 870 AD), the ice caps reached their maximum size by the end of the Little Ice Age (1890 AD), but then started receding until cooler climate caused re-advance in the period 1970-1995. All glacier fronts have been in rapid retreat since then, except for short-lived sudden advances due to so-called glacier surges, which are common in Iceland.
Mass balance measurements were initiated in 1988 and by now the mass balance of all main ice caps in Iceland is monitored annually. This involves measurement of the volume of winter snowfall during spring (positive contribution) and reading of total summer melting (negative contribution) as recorded by stakes placed on the ice caps. Adding the positive and negative contributions, we obtain the annual mass balance of the ice cap. The mass balance of all ice caps in the country has been negative since 1995, leading to a reduction of the total volume by 5-10%. Referring to the imagined 32 m thick water layer mentioned above, the melting of the ice caps amounts to thinning of that layer by roughly 15 cm every year.


Figure 1. About 10% of Iceland is covered by ice caps and smaller glaciers.
Figure 2. A southern outlet from Langjökull. Note the moraine crossing the lagoon, indicating a larger extent of the outlet glacier in the recent past.
Figure 3. Perspective view to SW over Langjökull. Note several volcanic formations around the ice cap, resulting from eruptions during and after the ice age.
Lake Hvítárvatn (left foreground) contains sediments that have recorded the story of glaciations in the region over the past 15,000 years.

Langjökull is the second largest ice cap in Iceland (900 km2). The maximum thickness is 750 m, but average thickness is only 200 m, and the total volume is close to 200 km3. Clear signs of a larger ice cap ~100 years ago are seen in Figure 2. Much of the meltwater from Langjökull disappears into porous lavas beneath the ice cap and flows as groundwater to lower elevations. The groundwater springs that emerge in the fissures at Þingvellir, the site of the Viking Age parliament, originate in Southern Langjökull. Near the ice cap, many geological formations resulting from volcanic eruptions under the much larger ice-age ice sheet can be observed. Examples include Hlöðufell, Geitlandsjökull and Jarlhettur.
Langjökull lies entirely below 1450 m elevation and modelling studies indicate that 90% of the volume of the ice cap will have melted by 2100 and that it will have disappeared by 2150. This result is based on future climate scenarios provided by the Intergovernmental Panel on Climate Change.
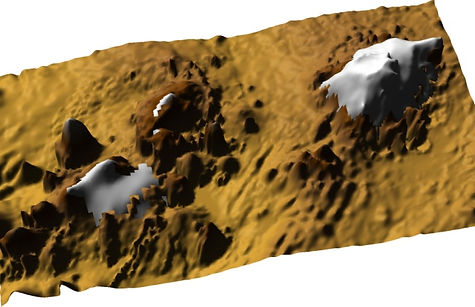
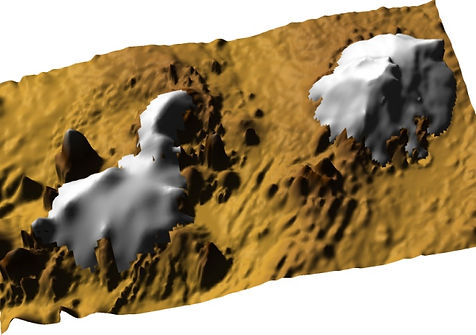
Figure 4. Left: The Langjökull and Hofsj�ökull ice caps in Central Iceland by 2000.
Figure 5. The ice caps by 2100, according to recent modelling of their development in a warmer climate.
Text and photograph: Thorsteinn Thorsteinsson (thor@vedur.is) and Oddur Sigurðsson (oddur@vedur.is)
Map of Iceland: Landmælingar Íslands / National Land Survey of Iceland: http://www.lmi.is/
Figure 3: From Áslaug Geirsdóttir.
Figure 4 and 5: S. Guðmundsson, T. Jóhannesson & colleagues.
Icelandic Meteorological Office: www.vedur.is